Well, there’s no such thing. But some clever property boffins have had a good crack at designing the next best thing, the DSR Score.
Property prices are based on the economics of supply and demand. Low supply and high demand will see prices rise, while the reverse scenario will see prices drop (it can happen!).
It’s no wonder then that the DSR Score is a prized piece of data amongst property researchers.
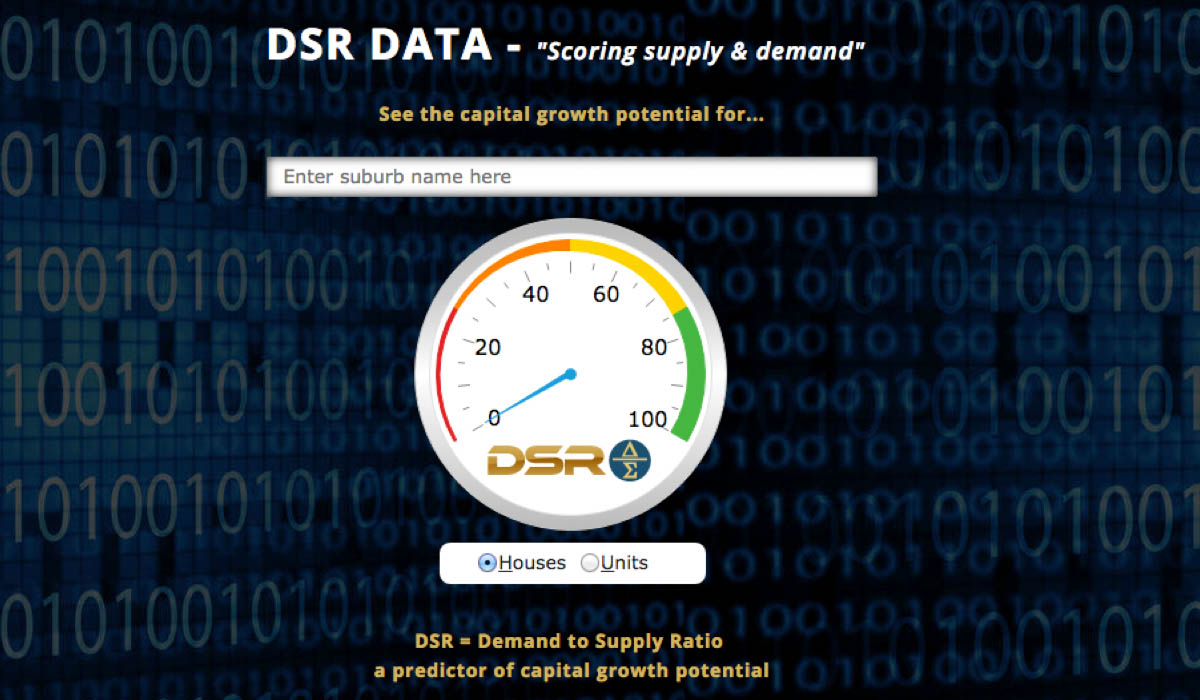
DSR stands for “demand to supply ratio” and this simple online tool calculates supply and demand based on aggregated data that indicates buyer demand and housing or unit supply.
Simply type in a postcode, select houses or unit, and you will see a DSR score of up to 100. A score of between 91 and 100 indicates buyers are trampling each other in their rush to secure a slice of this market. While a score of 0 to 9 is a no-go zone with plummeting prices.
Your Investment Property magazine suggests a score of 70+ is the Goldilocks market ‘just right’ for buyers wanting an optimum mix of growing demand and some restricted supply.
So should you buy a property based on DSR Score alone? Our advice – don’t do it. The DSR Score is one piece of data and it can help narrow down your search. But it’s based on a moment in time. Talk to local experts to find out what future plans exist for a suburb, such as new land releases, which might affect supply or demand.
Property Observer offers a list of questions that can help complement a DSR Score.
Want some local knowledge to reality check your analysis? Contact us for a chat.